\r\n---\r\n\r\n_Discover more data and resources here that will help you to implement your Hackathon project. If you have questions, reach out via the [#00_data_resources](https://app.slack.com/client/TQGF9P7K3/C01CAGJMMPU) channel._\r\n\r\n\r\n\r\nDatensatz vorschlagen / _Suggest a dataset_","location":"Laboratorium in Luzern","location_lat":0.0,"location_lon":0.0,"logo_url":"https://bucketeer-036aa605-c047-4623-8610-f1764b90cf98.s3.amazonaws.com/public/L7KGJ1NROQP4M3UNH5183L99.png","name":"Shape My City","starts_at":"2020-11-27T09:00","summary":"Solve tough city challenges like reducing traffic congestion and traffic, improving the utilization of pedestrian paths and bicycle lanes. ","webpage_url":"https://opendata.ch/projects/hslu_shape-my-city-2020/"}],"name":"events"},{"data":[{"autotext":"# 106: HackdaysLucerne - Quality of Life in Lucerne\nWhat can the city administration of Lucerne do to enhance the quality of life for its residents?\n\n## Challenge Definition\nDuring a student project, the city administration of Lucerne invited city residents to answer an online questionnaire about their perceived quality of life. The result of this online questionnaire is a rich set of data from 630 participants.\n\nAlready during the student-project, many interesting insights could be read from the data. Nevertheless, we would like to dig a little deeper in this set of data.\n\n## Ideas:\nWhat coherences can be found?\nHow do the demographics influence the different aspects of life that are connected to quality of life?\nWhat is your advice to the city administration?\nThe city administration is happy to use the results of this challenge to further improve quality of life in the city of Lucerne.\n\n## Data:\n\nAnswers of the online questionnaire (raw data, unpublished)\nResults of the student project\nResults of the (official) population survey 2019: www.lustat.ch/daten?id=26999\n\nContact administration of Lucerne: nadja.vonballmoos@stadtluzern.ch\n\n# Git-Hub Documentation:\n- README.md\n- cleaned_data.csv (anonymised)\n- HackdaysLucerne-LifeQualityAnalysis_Arbenz_Koelliker_Wenger (Correlation Matrix & Decision Tree)\n- CityEngagement_vs_Demographics\n- Comments-Analysis-StadtLuzern.ows (Word-Cloud)\n- clustering_personas.html\n- Analyse_Personas.xlsx\n","autotext_url":"https://github.com/EldhosePoulose/HackdaysLucerne-LifeQualityAnalysis","category_id":"","category_name":"","contact_url":"https://opendatahackdays.slack.com/archives/C01E2GJPS6A","created_at":"2020-11-11T07:19","download_url":"","event_name":"Shape My City","event_url":"https://new-hack.opendata.ch/event/35","excerpt":"# Challenge Definition\r\n\r\nDuring a student project, the city administration of Lucerne invited city residents to answer an online questionnaire about their perceived quality of life. The result of this online questionnaire is a rich set of data from 630 participants.\r\n\r\nAlready during the student-project, many interesting insights could be read from the data. Nevertheless, we would like to dig a little deeper in this set of data. \r\n\r\n- What coherences can be found?\r\n- How do the demographics inf...","hashtag":"","id":658,"ident":null,"image_url":"https://bucketeer-036aa605-c047-4623-8610-f1764b90cf98.s3.amazonaws.com/public/6Q89WSMD9BU9LNF0Z3ASKSC6.jpg","is_challenge":false,"is_webembed":false,"logo_color":"","logo_icon":"","longtext":"# Challenge Definition\r\n\r\nDuring a student project, the city administration of Lucerne invited city residents to answer an online questionnaire about their perceived quality of life. The result of this online questionnaire is a rich set of data from 630 participants.\r\n\r\nAlready during the student-project, many interesting insights could be read from the data. Nevertheless, we would like to dig a little deeper in this set of data. \r\n\r\n- What coherences can be found?\r\n- How do the demographics influence the different aspects of life that are connected to quality of life?\r\n- What is your advice to the city administration?\r\n\r\nThe city administration is happy to use the results of this challenge to further improve quality of life in the city of Lucerne.\r\n\r\nData:\r\n\r\n- Answers of the online questionnaire (raw data, unpublished)\r\n- Results of the student project\r\n- Results of the (official) population survey 2019: \r\nwww.lustat.ch/daten?id=26999\r\n\r\nContact: nadja.vonballmoos AT stadtluzern.ch\r\n\r\n\r\n\r\n\r\n# Project\r\n\r\n\r\n\r\n**Our Approach**\r\n\r\n\r\n\r\nTo get to our overall goals we have different approaches.\r\n\r\n- We build clusters to group the data.\r\n- We look at correlations and use machine learning models (LM, Decision Tree \u2026) to see which factors impact the overall quality of life the most.\r\n- We use text analysis to interpret the comment sections of the online questionnaire.\r\n- We search for specific demographic characteristics with a high or low quality of life to get further insights.\r\n\r\n\r\n**Main Results and Insights**\r\n\r\nDisclaimer: The data in this survey is not representative of the whole population of Lucerne\r\n\r\n***Clustering***\r\nBy appling clustering on the whole data set, we could find 5 groups that differ in various aspects of their quality perception.\r\n\r\n***Correlation Matrix***\r\nThe Correlation Matrix helps us to understand, which variables correlate to a certain degree with the response variable \"Lebensqualit\u00e4t Allg.\" \r\n\r\n\r\n***Decisicion Trees***\r\nThe Decision Tree gives us a idea, which variables could be relevant for the splits. \r\n\r\n\r\n\r\n***Closer Look to City Participation***\r\nWith help of logistic regression and classification trees we found that especially the variables \"Zuzug\" (time since moving in to Lucerne) and \"Bildung\" (eduction) have an influence on the city participation and engagement.\r\n\r\n\r\n\r\n\r\n***Text analysis***\r\nA text analysis of the answers to the question \"Wovon w\u00fcnschen Sie sich mehr?\" led to the following word cloud.\r\n\r\n\r\n\r\n**Next steps**\r\n\r\n- Further focus to more specific questions (based of the new insights)
\r\n- Further analysis with more survey data
\r\n- Build a framework including the most common used methods
\r\n ","maintainer":"nad_ja","name":"106: Quality of Life in Lucerne","phase":"Share","progress":50,"score":177,"source_url":"https://github.com/EldhosePoulose/HackdaysLucerne-LifeQualityAnalysis","stats":{"commits":0,"during":75,"people":8,"sizepitch":3947,"sizetotal":5496,"total":88,"updates":79},"summary":"What can the city administration of Lucerne do to enhance the quality of life for its residents?","team":"nad_ja, Marlen, Carole, eldhose_poulose, laszlo_klliker, irma, waarbenz, wdkoelli","team_count":8,"updated_at":"2020-11-28T15:30","url":"https://new-hack.opendata.ch/project/658","webpage_url":""},{"autotext":"","autotext_url":"","category_id":"","category_name":"","contact_url":"mailto:remo.oehninger@stud.hslu.ch","created_at":"2020-10-30T07:20","download_url":"","event_name":"Shape My City","event_url":"https://new-hack.opendata.ch/event/35","excerpt":"🌳🏡🌳 \r\n\r\n\r\nSummary\r\nWhy?\r\nThe Grossmatte in Littau and the Schweighof in Kriens are newly established resident areas. Both projects seek to reach the goals of the 2000-Watt-Society. There is a gap between the site owners and the resident\u2019s interests regarding the achievement of the 2000-Watt goals. The main question is, how do site owners encourage residents to alter their lifestyles to be more in line with the 2000-...","hashtag":"","id":655,"ident":null,"image_url":"https://bucketeer-036aa605-c047-4623-8610-f1764b90cf98.s3.amazonaws.com/public/M6R0TX7X68DHNJU7WBWN65D4.jpg","is_challenge":false,"is_webembed":false,"logo_color":"#ffffff","logo_icon":"","longtext":" 🌳🏡🌳 \r\n\r\n\r\nSummary\r\nWhy?\r\nThe Grossmatte in Littau and the Schweighof in Kriens are newly established resident areas. Both projects seek to reach the goals of the 2000-Watt-Society. There is a gap between the site owners and the resident\u2019s interests regarding the achievement of the 2000-Watt goals. The main question is, how do site owners encourage residents to alter their lifestyles to be more in line with the 2000-Watt goals? Also, there is a lack of identification of the residents with their neighborhood. \r\n\r\nWhat?\r\nCurrently, the residents can use an app, which displays all the information about their apartment\u2019s consumption. However, there is no possibility to compare their stats with other residents. Hence, they don\u2019t know whether their consumption is high or low in relation to other apartments. We therefore suggest, to put this information into context by introducing a comparison method which figures as an information tool as well as an incentive system. \r\n\r\nHow?\r\nOur idea is to introduce a ranking, which compares the individual consumption to the neighbor\u2019s consumptions. This ranking could be either included into the currently used app or displayed on screens in the hallways. Based on this ranking, a recommender system could be implemented, which informs the user about possible ways of reducing their consumption and improving their ranking. Finally, for example every year, the best couple of apartments could be offered a benefit. Possible are financial, physical or digital benefits. We recommend including all the services available on the 2000-Watt site when defining the benefits. For example, coupons for stores and coffee shops might foster the social life and the identification of the residents with the site. Apart from stores and coffee shops, coupons for the car sharing service might help to introduce people to the car sharing concept and reduce \u201cusage barriers\u201d. \r\n\r\n
\r\nProcess and Methods\r\nFindings & Obstacles\r\nIn order to implement an effective incentive system, the comparability of the consumption data is inevitable. The apartments differ in size and in the count of inhabitants, which might distort the ranking in an unfair way. As well as the algorithm, the incentive is a crucial part of the system. The ETH Z\u00fcrich, together with the EWZ, conducted a research project, which studied the effectiveness of different forms of incentives on reducing energy consumption. \r\nBonusmodelle f\u00fcr energieeffiziente Haushalte - EWZ\r\n\r\n\r\n
\r\nPrototype\r\nTest our two different prototyps and click on the phone or on the desktop image. \r\n
\r\n\r\n
\r\n\r\n\r\n
\r\nOutlook\r\nFirst, the project would have to be evaluated and approved by the investors. Then a team of experts and developers would have to be assembled to continue the project. For this purpose, a data pool with all necessary data would have to be set up, which could then be used for the calculations. \r\nTo continue this project, we would recommend that the project team would exchange information with the EWZ and thus benefit from their experience. \r\n\r\n
\r\n
\r\nData & Informations: \r\n2000-Watt-Site Schweighof, Kriens
\r\n2000-Watt-Site Grossmatte, Littau
\r\nCatalogue of criteria\r\n\r\n","maintainer":"waoehnin","name":"10 - 2000-Watt-Site - Reduction of energy consumption","phase":"Training","progress":20,"score":139,"source_url":"","stats":{"commits":0,"during":57,"people":2,"sizepitch":4128,"sizetotal":4128,"total":96,"updates":93},"summary":"","team":"waoehnin, AR8","team_count":2,"updated_at":"2020-11-28T15:04","url":"https://new-hack.opendata.ch/project/655","webpage_url":"https://www.figma.com/proto/cuotC3oRfbtYya1T93GbxO/Prototype-App-eJames?node-id=1%3A2&scaling=scale-down"},{"autotext":"","autotext_url":"","category_id":"","category_name":"","contact_url":"","created_at":"2020-10-29T15:15","download_url":"","event_name":"Shape My City","event_url":"https://new-hack.opendata.ch/event/35","excerpt":"Topic:\r\nOn the Nidfeld site in Kriens, a new neighborhood with apartments and commercial space is currently under construction. To avoid overloading the traffic situation in the area during peak hours, there is a given requirement (by the authorities) on how many cars are allowed to enter and leave the site between 17:00 CEST / 5 PM and 18:00 CEST / 6 PM. \r\n\r\nThe \"Fahrtenmodell\" available to the site developer Losinger Marazzi AG estimates that the maximum of 200 entrances and exits wil...","hashtag":"","id":616,"ident":null,"image_url":"https://www.losinger-marazzi.ch/media/filer_public_thumbnails/filer_public/24/bc/24bc0071-30c4-4dd1-b541-b12f67802a16/8255-nidfeld__aussenbilder_kopfbau_f1.jpg__1000x1000_q60_subsampling-2.jpg","is_challenge":false,"is_webembed":true,"logo_color":"#d6ffff","logo_icon":"","longtext":"Topic:\r\nOn the Nidfeld site in Kriens, a new neighborhood with apartments and commercial space is currently under construction. To avoid overloading the traffic situation in the area during peak hours, there is a given requirement (by the authorities) on how many cars are allowed to enter and leave the site between 17:00 CEST / 5 PM and 18:00 CEST / 6 PM. \r\n\r\nThe \"Fahrtenmodell\" available to the site developer Losinger Marazzi AG estimates that the maximum of 200 entrances and exits will be exceeded once the new site is in use. \r\n\r\nChallenge:\r\nUse the \"Fahrtenmodell\" to gain ideas about reducing the number of car rides during the peak hour. Review / test your solutions based on the \"Fahrtenmodell\".\r\n\r\nPossible Solutions:\r\nLosinger Marazzi's current plan is to slow down the exit barrier to limit the number of exits temporarily. However, there must be a better solution than this. For example, there might be ways to create incentives for residents, workers, and customers to bypass the peak hour or use public transport, bicycles, or car sharing. You are free to think out of the box and come up with solutions that reduce the number of car rides to the allowed maximum. \r\n\r\nData & Tools:\r\n\r\n\r\nFirst update:\r\nInitially, we have evaluated different possible solutions to reduce traffic during rush hours caused by residents. Still, on the other hand, we are also questioning the Mobilit\u00e4tsb\u00fcro's calculation, i.e., Google shows that Prodega customers peak around midday-2pm, which would imply that the 10% share of DWV in the peak hours 5pm-6pm seems overly optimistic. We identified two possible stakeholder groups where significant improvements can be made:\r\n1. Residents\r\n2. Prodega customers\r\n\r\n## Result:\r\nWe evaluated possible solutions to reduce traffic during rush hours caused by the key stakeholders: residents and Prodega customers. Although a third group - employees of companies located in the area - contributes to the traffic situation, we focused on the first two groups. Measures for residents and Prodega customers seem to be more feasible than for employees. Before coming up with ideas and evaluating them, we questioned the data that was provided to us. When comparing the numbers of Prodega visitors with the \"Popular Times\" section for Prodega Kriens on Google, we detected that the number of customers peaked around midday-2pm. This implies that the Mobilit\u00e4tsb\u00fcro assumption that 10% of DWV is from 5pm to 6pm seems overly optimistic.\r\n\r\n## Key Stakeholders:\r\n\r\n* Residents\r\n* Prodega customers\r\n\r\n##\u00a0Process:\r\nIn the beginning, we sat together to brainstorm. The goal was to get a wide set of ideas prioritized and evaluated in detail. This resulted in the following mindmap containing ideas for residents and Prodega customers:\r\n\r\n\r\n###\u00a0Residents:\r\nWe believe that financial benefits or other incentives can influence human behavior. Therefore we came up with ideas for residents to not use their cars during rush hour. The following options are among them:\r\n\r\n* Carpooling service via App\r\n* Partially subsidized car-sharing services\r\n* Signaling: Control of traffic flow (i.e., sending outgoing traffic in one direction only)\r\n* Reduced or even free public transport tickets\r\n* Mobility Car Sharing promotion, i.e., free annual subscription\r\n* Variable monthly parking fee. I.e., discounts if no exits in peak hours are registered. This may follow a staggered approach, e.g., no departures will give the highest discount, whereas up to 10 exits per month will yield a slightly reduced discount. \r\n* Free delivery services for residents: We believe a certain share of exits may be attributed to grocery shopping.\r\n* commercial stores on the ground floor: evaluate supermarket\r\n* Make the way between the living area and nearest train station more attractive by offering e-mobility solutions like e-scooters or enuu vehicles, attractive pricing necessary.\r\n\r\n### Prodega:\r\n* Partially subsidized delivery service for Restaurants\r\n* Time-dependent discounts. I.e., time the discounts to only be valid during non-peak hours. Prodega's cooperation may be awarded a rent deduction. \r\n* Promote online shopping services.\r\n* Promote combined pickup for multiple customers\r\n* Time-dependent parking fee:\r\n * Free of charge from 10am-3pm\r\n * From 4-7pm pm e.g. 5 francs/15minutes.\r\n\r\n\r\n\r\n\r\n## Evaluation of Main Ideas\r\n\r\n\r\n### Variable monthly parking fee for residents and employees\r\n\r\nImplement a bonus system for individuals that rent a private parking spot. The default rent is set to above average in the beginning of the month. Residents can reduce their rent by not exiting the area during the peak time slot 5-6 pm. If a certain number of exits or entries during the peak time is not surpassed, the rental price will drop significantly. The App designed for the area could display the savings for each resident.\r\n\r\n| Area | Assessment | \r\n| ------------- | -------------|\r\n| Effect | Lowers traffic during peak time. |\r\n| Feasibility | Altering the rental price does not require any costly steps. Registration of exit and entrance can be measured either by sensors on the parking spot or by registration of the license plate number at the exit/entrance location. |\r\n| Financing | Above average rental compensates the bonus. |\r\n| Acceptance | As the measure is designed as a bonus and not as a malus system, we assume wide acceptance. |\r\n| Risk | Above average (upfront) prices for parking spots may have a negative impact on attractivity of living area |\r\n\r\n\r\n### Time-dependent discounts for Prodega customers \r\n\r\nIdentify customers that regularly shop during peak times at Prodega. Analyze their shopping behavior and offer time-dependent personal discounts (i.e., use Supercard data). For example: \"10% on mayonnaise before 5pm or after 6 pm.\" \r\n\r\n| Area | Assessment | \r\n| ------------- | -------------|\r\n| Effect | Altering preferred shopping time for customers |\r\n| Feasibility | Identification of products and customers with the biggest impact is feasible under the condition that the data collection occurs through loyalty cards. Difficult to convince Prodega to participate. |\r\n| Financing | Prodega discount could be financed through a reduction of rent. |\r\n| Acceptance | As the measure is designed as a bonus and not as a malus system we assume wide acceptance. Acceptance of Prodega is questionable. |\r\n| Risk | Prodega is not willing to participate. Cost of discount financing may be too high. |\r\n\r\n\r\n### Reduced or free public transport tickets & Subsidized Mobility Car Sharing for residents\r\n\r\nReduced public transport cost for residents may lower car usage. Subsidizing the annual subscription of Mobility Car Sharing for the residents and providing on-premise Mobility Cars might get people not to want to own a car.\r\n\r\n| Area | Assessment | \r\n| ------------- | -------------|\r\n| Effect | Shift from car to public transport or car sharing results in less traffic. |\r\n| Feasibility | Measure is easily implementable under the condition that financing is solved. |\r\n| Financing | Finance through higher parking spot price or include the discount in the rent. |\r\n| Acceptance | Depends on financing. Public transport discount needs to be conveyed as an extra service. |\r\n| Risk | Strong dependence on the quality of public transport. Public transport discount may not lead to usage. |\r\n\r\n\r\n### E-Mobility solutions between living area and nearest/most important train stations\r\n\r\nIn order to increase usage of public transport the transfer time from the living area to the nearest train station is crucial. To shorten the transfer time, the availability of e-mobility vehicles like e-scooters, e-bikes or e-cars (for example, Enuu) could be ensured. The provider may implement a specific subscription model for residents.\r\n\r\n| Area | Assessment | \r\n| ------------- | -------------|\r\n| Effect | Attractivity of public transport increases. Shift from car to public transport results in less traffic.|\r\n| Feasibility | Feasible if e-mobility providers are willing to collaborate.\u00a0|\r\n| Financing | Fixed cost of loading stations may be financed by the e-mobility providers.|\r\n| Acceptance | Additional mobility offer does not have any negative impact on residents and should be widely accepted.|\r\n| Risk | Usage of e-mobility depends on the weather situation. Constant availability of e-vehicles is difficult to guarantee.|\r\n\r\n## Next Steps:\r\n\r\nBefore proceeding with further analysis, we strongly recommend to the challenge owner to verify the data provided by the \"Mobilit\u00e4tsb\u00fcro\" as we can not assure its validity. LUSTAT and Astra may be the right institutions to get in touch with. Unfortunately, we could not communicate with them as we did not get any responses either by phone or by email.\r\n\r\nWe spent a fair amount of time trying to model the traffic flow using the open-source and state-of-the-art urban mobility modeling software \"[SUMO](https://www.eclipse.org/sumo/)\". We deem the software's capability as quite significant and thus recommend investing more time in modeling the traffic flow surrounding the area to trial various ideas. We are attaching the developed modeling environment in the following ZIP file: [Link](https://drive.google.com/file/d/1_9lDKgb6qRKM_7GfEMmVVb49CJUFXU6B/view?usp=sharing)\r\n\r\n","maintainer":"waarbenz","name":"11 - Reduce car rides at traffic peak hours","phase":"Share","progress":50,"score":138,"source_url":"","stats":{"commits":0,"during":18,"people":7,"sizepitch":10770,"sizetotal":10839,"total":62,"updates":54},"summary":"How to cope with traffic on the Nidfeld 2000-Watt Site in Kriens (LU)","team":"waarbenz, Marlen, wdkoelli, maurice, Konstantinos, nico, niclas","team_count":7,"updated_at":"2020-11-28T15:01","url":"https://new-hack.opendata.ch/project/616","webpage_url":"https://docs.google.com/presentation/d/e/2PACX-1vQ_tkdHbqpTPlf8gd8eBb3v0KrKmXabo2p_EIrYe9s5x2xdjiixr4kP6iUUs7t-Y_MyTKyu3KI9fgZh/embed?start=false&loop=false&delayms=3000"},{"autotext":"# Readme\n## Hackathon\nThis jupyter notebook was created for the \"Open Data Hackdays - Shape My City\" event: https://opendata.ch/projects/hslu_shape-my-city-2020/ \n\n## Installation\n\nIf downloaded locally, install all required modules & create folder structure.\n \n |--root\n |---Data \n |---interview_n.docx\n\n## Usage\n\nProvide your own API key and url when calling IBM Watson in Cell [15].\n\n## Data\n\nPut Interviews as .docx files in folder \"Data\". The analysed csv data will be saved to the current working directory.\n\n## CODE\nWe have written selfdocumenting code, which you can access directly on Google Colab: CODE on COLAB \n\n## DASHBOARD\nThe interactive Dashboard can be found under the following link: Interactive Dashboard \n\n---\n","autotext_url":"https://gitlab.com/eikyu/naked_shareholder","category_id":"","category_name":"","contact_url":"https://gitlab.com/eikyu/naked_shareholder/issues","created_at":"2020-11-27T15:51","download_url":"","event_name":"Shape My City","event_url":"https://new-hack.opendata.ch/event/35","excerpt":"Development of a tool for the 360\u00b0 analysis of stakeholder interests and identification of key opinion leaders (KOLs)
\r\n\r\nWHYFor large projects with high level of investments such as building projects delays and changes during the planning stages are a risk. One of the measurements to mitigate this is to closely manage the different stakeholders to identify hidden requirements and problems as early as possible.\r\n\r\nIVO Innenentwicklung AG advises and supports municipalities...","hashtag":"","id":665,"ident":null,"image_url":"https://bucketeer-036aa605-c047-4623-8610-f1764b90cf98.s3.amazonaws.com/public/SRM8ALXNQEGFPVVWD7H9E7WI.jpg","is_challenge":false,"is_webembed":true,"logo_color":"","logo_icon":"","longtext":"Development of a tool for the 360\u00b0 analysis of stakeholder interests and identification of key opinion leaders (KOLs)
\r\n\r\nWHYFor large projects with high level of investments such as building projects delays and changes during the planning stages are a risk. One of the measurements to mitigate this is to closely manage the different stakeholders to identify hidden requirements and problems as early as possible.\r\n\r\nIVO Innenentwicklung AG advises and supports municipalities and cities in the transformation of urban spaces. In order for IVO to meet the interests of as many stakeholders as possible, their needs and requirements are assessed by means of personal interviews and online surveys, which serves as a good data basis but does not provide a quick overview on status, issues and stakeholder group.\r\n
\r\nBUSINESS VALUE\r\nBetter understanding of stakeholder and community needs\r\nSupport in opinion forming with a tailor-made communication strategy by identifying KOLs\r\nReputation building and expectation management through insights gained from stakeholder management\r\nEfficient and structured approach to data analysis\r\n
\r\n\r\n\r\n
\r\nWHATWe are addressing this problem by providing a concise but informative dashboard containing grouping, qualification and prioritization of the stakeholders in order to make more of the available data and provide users with a fast overview by project.\r\n
\r\n\r\nHOWAggregation multiple data sources such as data from online surveys (MS Excel), transcripts of personal interviews (MS Word) by NLP sentiment-analysis / part-of-speech-tagging, network analysis, dependency detection and interactive dashboards.\r\n
\r\n\r\nData sources:\r\n\r\n - Data from online surveys (MS Excel)
\r\n - Transcripts of personal interviews (MS Word)
\r\n - external data sources as required
\r\n \r\n\r\nAapproaches:\r\n\r\n - NLP: Sentiment-Analysis, Topic Modelling
\r\n - Anomaly detection, dependency detection
\r\n - Interactive Dashboards
\r\n \r\n\r\nTechnology:\r\n\r\n - Python, R
\r\n - IBM Watson
\r\n - Google NLP API
\r\n \r\n
\r\nRepository Link:\r\nGoogle Colab\r\n\r\n
\r\nNEXT \r\n\r\n - Presentation to and discussion with IVO Innenentwicklung AG
\r\n - Improve Data Collection and set up proper ETL-process
\r\n - User Testings with Dashboard - Initiate Improvement Feedback Cycles
\r\n - Launch MVP
\r\n\r\n\r\n\r\n\r\n\r\n\r\n","maintainer":"silvan_leibacher","name":"9: 360\u00b0 Stakeholderfeedback ","phase":"Publish","progress":40,"score":133,"source_url":"https://gitlab.com/eikyu/naked_shareholder","stats":{"commits":0,"during":52,"people":3,"sizepitch":2965,"sizetotal":4062,"total":52,"updates":48},"summary":"Stakeholderanalysis dashboard to mitigate risks in building projects.","team":"silvan_leibacher, grandiculus, kail_kuhn","team_count":3,"updated_at":"2020-11-28T13:26","url":"https://new-hack.opendata.ch/project/665","webpage_url":"https://app.powerbi.com/view?r=eyJrIjoiMTA5OTBlY2QtNTcyNi00N2VjLWIxNTgtZTQ5YmI3ZjYzMDk2IiwidCI6IjhkYTZkN2QxLTFiZjQtNGJkZi05NmE4LTIyOTFhM2MxZDA4MiJ9"},{"autotext":"# Solar Energy in the City\n\n**Open Data Hackdays \u2013 Shape my City -- Challenge 03**\n**November 27 -- 28 2020**\n\n## Introduction\n\nSolar energy is often overlooked when old buildings are renovated or new buildings are constructed. \nHowever, every house that maintains its individual solar power station is less reliant on the public \ngrid which in turn helps to lower energy costs for the residents. This makes solar energy a very \ninteresting power source.\n\nGiven that the canton of Lucerne specified in 2019 that every new building is obliged to produce its \nown electricity, it is even more surprising that the rate of newly built solar power stations is quite \nlow.\n\n## Main objective\nOur goal is to analyze all buildings within the city limits of Lucerne and identify clusters of those \nbuildings which are outstandingly suitable for producing solar energy. Factors we will look at include \n(but are not limited to) the geographic location, the orientation of the building and the slope of the \nbuilding's roof.\n\nThese clusters are then further analyzed (Which percentage of buildings already produce solar energy? \nHow suitable are the remaining buildings?) in order to identify those areas in the city that are most \nattractive for the installation of a solar system. These insights can then be used to provide \ninformation about the framework conditions, the new legal framework and available public grants in \norder to raise the number of solar systems in the city.\n\nThe main data sources were:\n* Solar Potential Register \n* Building and Apartment Register\n\nBoth datasets describe data in the region of the city of Lucerne. \n\n\n## Questions to be answered\n\n* Which buildings have the highest energy output (kWh)?\n* Density: Where are many buildings with high potential close together?\n* Density 2: Where are many buildings with at least some potential close together?\n* Ownership: Where are many buildings with all different owners close together?\n* Which buildings do have potential and are not (re)constructed for many years?\n\n**Filtering questions:**\n\n* Which of those are only for electricity or only for thermal power?\n* Which of those are under monumental protection?\n* Which of those are not downtown?\n\n\n## Pre-processing of the data\nIn order to start working with the data that has been gathered prior to the Hackathlon, we had to \npreprocess it accordingly. As mentioned above, the data basis provided for this project, came from \ntwo different sources. Therefore, a thorough preprocessing of both datasets was key. It was \nimperative to have all datasets in the same data type - and preferably .csv or .xlsx, since we have\nreceived the data in many different shapes and data types. \n\nIn a first step, the data provided by the solar potential register was preprocessed. Since the main \ngoal is to provide one universal excel sheet to our challenge owner, this large dataset had to be \nreduced. First, we filtered by roof areas that have a promising solar potential. In another step,\nwe were able to group by the identification number of the buildings. This step was necessary in \nidentifying the roofs because the dataset provided divided the roofs into different parts. With this \nstep we were able to create a better overview per roof. However, this means that several other \ncolumns had to be summed up or taken the mean value of it in order to group the dataset by an ID. \n\nIn a second step, the data provided by the building and apartment register had to be merged into one \nbig dataset. We have received over ten different data sets from the building and apartment register. \nThese different datasets came in many different shapes such as *.dsv*, *.shp*, *.prj*, or *.shx*. \nOnce this was converted into the desired type, all these datasets were merged into one big dataset \nusing R.\n\nUltimately, the two datasets were joined by an unique building identifier found on both datasets. \nThis allowed us to add additional data from the building and apartment register. This preprocessing \napproach turned out to be the key to a successful accomplishment of this challenge. Afterwards,\nthe dataset was transformed as needed and some calculations were performed.\n\n## Problems identified\n\n### Existing solar panel\nAlthough the obtained dataset from the building and apartment register contains a column that shows\nwhether a building already has a solar panel installed, it turned out during the preprocessing that \nthe data quality was rather low. The values returned were either \u201cN/A\u201d or \u201c0\u201d, which means that it was \nunclear whether there was a solar panel, or there was certainly no solar panel installed. However, we\ndid not get any buildings that had solar panels installed, which was rather unlikely. Therefore, we \nwere unable to identify and sort out buildings that already had solar panels and are not to be \ncontacted.\n\n## Results\nThe main goal of the challenge was to provide the challenge owner with an excel file that would help \nhim promote the installation of solar panels. This goal was fully reached and the challenge therefore \nsuccessfully completed. \n\n## Outlook and further work\n\nSince the desired product could be delivered in the form of an excel file and so the main goal was \nachieved, the group went on to cluster the buildings based on the following features:\n\n* Photovoltaic yield per year (kWh/a)\n* Total roof area\n* Building category\n* Building period\n* Building coordinates and proximity\n\nThe following algorithms were used:\n\n* k-Means\n* GMM (Gaussian Mixture Models)\n\nExample for clustering the buildings with k-means:\n\n\n\nExample for clustering the buildings with GMM:\n\n\n\nThe results were thereafter imported into Google Earth for a more user-friendly and intuitive\nvisualization:\n\n\n\nHowever, the interpretation of both clustering results with k-means and GMM proved to be quite\ndifficult for the moment, so more work should go into the interpretation of the results and the\ntuning of the models. This way, we should be able to find a suitable number of clusters and \ninterpret the results accordingly.\n","autotext_url":"https://github.com/solarlucerne/solarpotential_lucerne","category_id":"","category_name":"","contact_url":"https://opendatahackdays.slack.com/archives/C01CGMHGS92","created_at":"2020-10-29T18:25","download_url":"","event_name":"Shape My City","event_url":"https://new-hack.opendata.ch/event/35","excerpt":"# The idea\r\nSolar energy is often overlooked when old buildings are renovated or new buildings are constructed. However, every house that maintains its individual solar power station is less reliant on the public grid which in turn helps to lower energy costs for the residents. This makes solar energy a very interesting power source. \r\n\r\nGiven that the canton of Lucerne specified in 2019 that every new building is obliged to produce its own electricity, it is even more surprising that the rate o...","hashtag":"","id":619,"ident":null,"image_url":"https://upload.wikimedia.org/wikipedia/commons/thumb/b/b0/Photovoltaic_power_station%2C_Glynn_Co%2C_GA%2C_US.jpg/1024px-Photovoltaic_power_station%2C_Glynn_Co%2C_GA%2C_US.jpg","is_challenge":true,"is_webembed":true,"logo_color":"","logo_icon":"","longtext":"# The idea\r\nSolar energy is often overlooked when old buildings are renovated or new buildings are constructed. However, every house that maintains its individual solar power station is less reliant on the public grid which in turn helps to lower energy costs for the residents. This makes solar energy a very interesting power source. \r\n\r\nGiven that the canton of Lucerne specified in 2019 that every new building is obliged to produce its own electricity, it is even more surprising that the rate of newly built solar power stations is quite low.\r\n\r\n# Our goal\r\nOur goal is to analyze all buildings within the city limits of Lucerne and identify clusters of those buildings which are outstandingly suitable for producing solar energy. Factors we will look at include (but are not limited to) the geographic location, the orientation of the building and the slope of the building's roof.\r\n\r\nThese clusters are then further analyzed (Which percentage of buildings already produce solar energy? How suitable are the remaining buildings?) in order to identify those areas in the city that are most attractive for the installation of a solar system. These insights can then be used to provide information about the framework conditions, the new legal framework and available public grants in order to raise the number of solar systems in the city.\r\n\r\n# What we want to do and how we want to do it\r\nWe want to utilize geospatial data as well as data regarding the suitability of building rooftops. The finished working product *could* be an application or an interactive map that allows for filtering the clusters we will identify.\r\n\r\n# Data and tools\r\n* swisstopo\r\n* Solarpotentialkataster Kanton Luzern\r\n* Google Maps / OpenStreetMap\r\n\r\nHeader image credit: Photograph by Jud McCranie, distributed under a CC BY-SA 4.0 licence.","maintainer":"thomas_j","name":"03. Solar Energy in the City","phase":"Challenge","progress":0,"score":104,"source_url":"https://github.com/solarlucerne/solarpotential_lucerne","stats":{"commits":0,"during":47,"people":5,"sizepitch":2241,"sizetotal":8799,"total":63,"updates":57},"summary":"We are searching the spots that are most feasible for utilizing solar energy in the city.","team":"thomas_j, giuseppe_peronato, jeymarc_sison, matej_kostadinov, michael_schmid","team_count":5,"updated_at":"2020-11-28T14:02","url":"https://new-hack.opendata.ch/project/619","webpage_url":"https://docs.google.com/presentation/d/e/2PACX-1vRzcWzB5hGsQZhhrbcQjKbabl0_xga4ngIuoJrAmKa8HLOBe14wbdduXhKPiz3ZRg/embed"},{"autotext":"","autotext_url":"","category_id":"","category_name":"","contact_url":"https://www.hslu.ch/de-ch/hochschule-luzern/ueber-uns/personensuche/profile/?pid=3348","created_at":"2020-11-28T10:26","download_url":"","event_name":"Shape My City","event_url":"https://new-hack.opendata.ch/event/35","excerpt":"\r\n##Initial Situation\r\nInterviews with pharmacies and Webinars by industry partners highlighted that the drug sharing has much potential in being optimized. Specifically, the exchange of medicines among pharmacies or other stakeholders is not fully coordinated and automated.\r\n\r\nThe Corona pandemic exposed issues in quality and quantity of material such as masks. Various materials of reduced quality have come into circulation during this period due to insufficient stocks and control mechanisms. A...","hashtag":"","id":667,"ident":null,"image_url":"https://bucketeer-036aa605-c047-4623-8610-f1764b90cf98.s3.amazonaws.com/public/I934VPMF13RV5734A1CXEBTN.png","is_challenge":true,"is_webembed":true,"logo_color":"#f5cccc","logo_icon":"","longtext":"\r\n##Initial Situation\r\nInterviews with pharmacies and Webinars by industry partners highlighted that the drug sharing has much potential in being optimized. Specifically, the exchange of medicines among pharmacies or other stakeholders is not fully coordinated and automated.\r\n\r\nThe Corona pandemic exposed issues in quality and quantity of material such as masks. Various materials of reduced quality have come into circulation during this period due to insufficient stocks and control mechanisms. Another problem is the insufficient communication between pharmacists and other stakeholders. For example, there is no visible stock of existing drugs in the entire circulation. A pharmacy can therefore not exactly know what other pharmacies have in their stock. This leads to inefficiencies in the exchange of medicines directly between pharmacies and various stakeholders such as patients for example. As a result, shortages occur in situations of increased demand as it is a challenge to track the locations and ownerships of the products.\r\n
\r\n##Goal of the Challenge\r\nWe intend to optimize the exchange, shipping and transport of medicines between stakeholders in the healthcare industry using Blockchain technology. The goal is to create a prototype of a Blockchain where the transactions between the stakeholders are visible at all time, productions and orders are automated and security against fraud or counterfeiting is given. \r\n
\r\n##Outcome\r\nThe output of these Hackdays is a basic prototype of a Blockchain that comes with its concept plan and description.\r\n\r\n\r\n####Concept:\r\nThe ecosystem of a healthcare industry including different process were created and visualized on a Business Process Model and Notation (BPMN) concept. This process illustrated some of the most important transactions of such an ecosystem from initial production of the drug to its consumption. Furthermore, the whole concept ensures that all information that occurs after each transaction is stored in the Blockchain. The Blockchain database not only ensures that transaction data cannot be subsequently manipulated, it also opens the way for drug manufacturers and pharmacies to make data analysis to improve their processes, products and services according to the latest demand.\r\n\r\n\r\n\r\nA more detailed description of the concept and its various processes can be found in our repository . \r\n\r\n####Prototype Blockchain:\r\nA prototype of a Blockchain was created with the use of Python programming language. By implementing various participants (pharma manufacturer), assets (the items such as drugs) and transactions (the various processes such as the order or deliver of drugs) in to the Blockchain, it was possible to automate the generation of transactions and its underlying blocks of the Blockchain. Thereby, Use cases such as fraud detection and information transparency were addressed and implemented in our prototype. Below you will find an output of the Python-file, where the individual stocks of the various stakeholders regarding a specific type of medicine is illustrated. This use case would help the pharma manufacturer to monitor and control the circulation of its product and therefore forecast and future demand.\r\n\r\n\r\n
\r\n##Next Steps\r\n\r\n - This prototype of a Blockchain will further be presented and discussed by the City of Lucerne for further development
\r\n - The technology and system behind this Blockchain may not only be applied on drug sharing, but also on other areas such as food waste or recycling
\r\n - The increased efficiency and transparency of Blockchain may the right approach for a stakeholder relationship management model
\r\n \r\n
\r\nBelow you find the slides to our final presentation of the hackdays:\r\n\r\n
\r\n####Contact\r\nFor further information on this project, please contact the challenge owner: \r\n Matthias Albisser.\r\n \r\n\r\n\r\n\r\n","maintainer":"group007","name":"Drug Sharing Ecosystem Driven by Blockchain","phase":"Challenge","progress":0,"score":96,"source_url":"https://drive.google.com/drive/folders/1RSqah29pnHjzddflcLhnI3TPh6pl2gEH","stats":{"commits":0,"during":27,"people":1,"sizepitch":4603,"sizetotal":4710,"total":70,"updates":68},"summary":"Blockchain was developed to increase transparency, security and automatization in the health care industry.","team":"group007","team_count":1,"updated_at":"2020-11-29T13:56","url":"https://new-hack.opendata.ch/project/667","webpage_url":""},{"autotext":"## Hackathon Shape my City - 27-28. November 2020\n\n# 06 Quantification of visitors of cultural events in Lucerne\n\n### Create a prototype of a technical solution to count visitors of cultural events\n\nTeam: Yvonne Sch\u00e4rli, Salome Isch, Thushanth Gunasegaram, Adriana Ricklin, Cengiz Cetinkaya, Christina Sudermann \n\n## 1) What is the challenge about\n\n### Problem Description\nThe City of Lucerne would like to register how many people visiting cultural events in the City of Lucerne are actually residents of Lucerne and how many are visiting from the agglomeration (K5: Ebikon, Emmen, Horw, Kriens, City of Lucerne incl. Littau and Reussb\u00fchl) or even outside the Region. This information would be used by the City of Lucerne to discuss more accurately with the agglomeration, how much they have to pay to the city on cultural promotion.\n\n### Idea of Implementation \nAt the entrance of the cultural events we would put a tablet where visitors are asked to insert the zip code of their home address. This would be a voluntary process and the visitors will be rewarded with a funny thank you note, once they put in the information. For the City of Lucerne a dashboard with visualisations of the visitor flow to the different cultural events can be created.\n\n### Goal\nCreate a prototype of a technical solution to count visitors of cultural events. What is the percentage of visitors from the city of Lucerne and the surrounding municipalities?\n\n### Data\nThere is no data which can be used as the goal of the challenge is to find a way of collecting the data.\n\n### Partner\nCity of Lucerne, Kultur & Sport\n\nLink to the Hackathon Challenges:\n[hack.opendata](https://hack.opendata.ch/event/35#top)\n\n## 2) Practical Approach to solve the challenge\n\n### Architecture\nFor this project the database management system MongoDB is used for the data storage. For the backend Python Flask is used, for the frontend the JavaScript React Framework and for the visualisations Tableau. \n\n\n### Backend\nFor Backend the Python web application framework Flask is used. A connection to MongoDB is setup.\nFunctions to get all postal codes and events entered by the visitors of the events on the web app and to write it into the database. \n\n### Frontend: WebApp\nFor the Front end Web development, the JavaScript React Framework was used. For this challenge a very simple App will be setup because only a few buttons are needed for the input of the zip codes. It should be as simple as possible for the user.\nThe user gets a feedback after inserting the zip code on the tablet.\n\nHere is a first look of the WebApp with different buttons for the zip codes. \n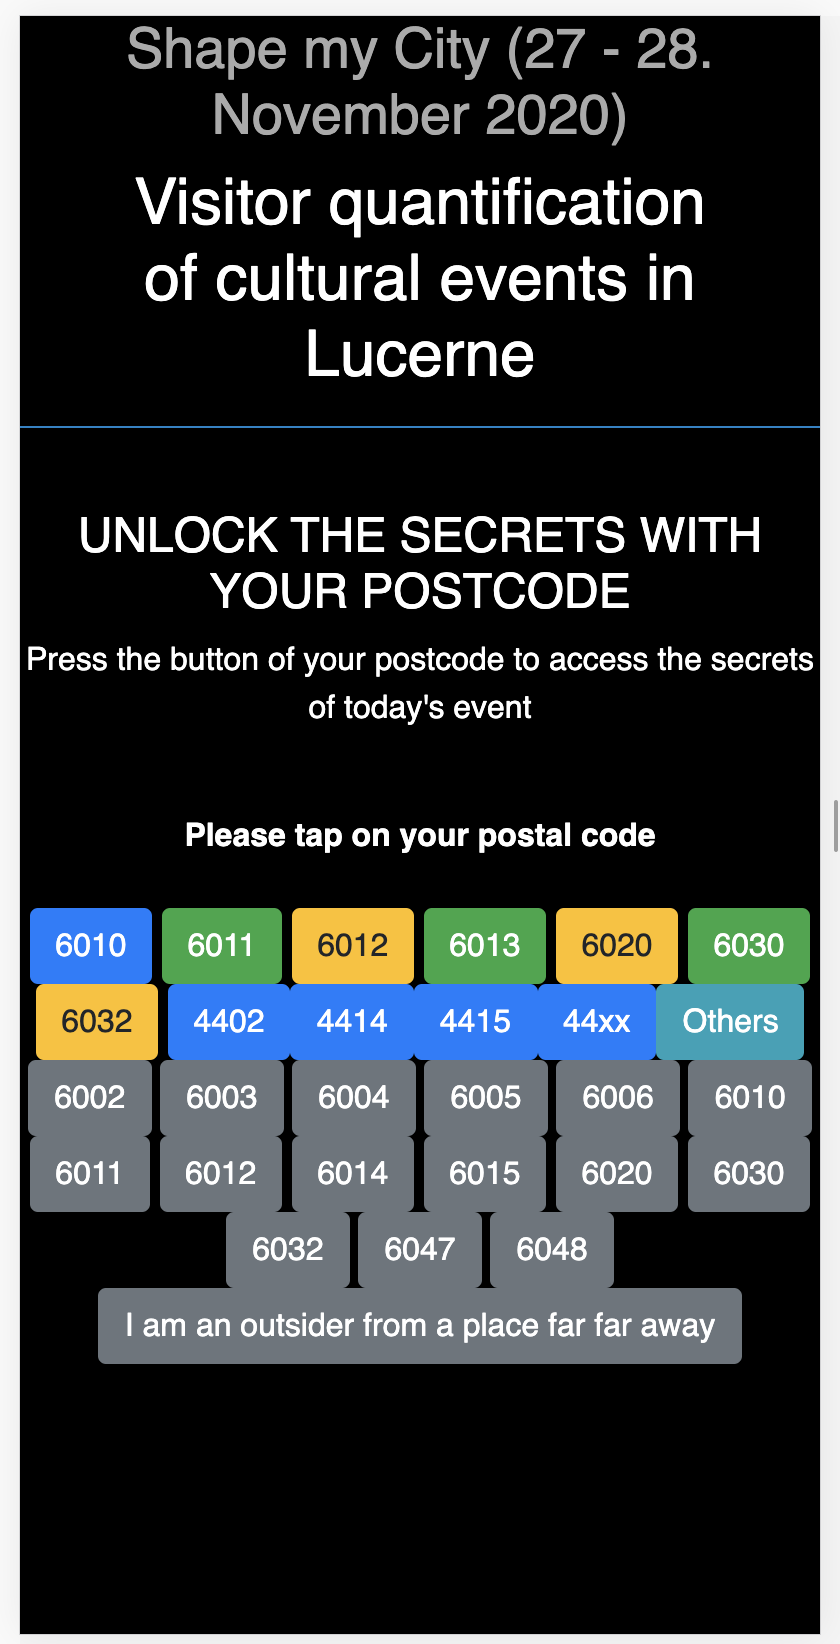\n\n### Visualisation\nFor the visualisations we wanted to set up a connection to the MongoDB, but this was in the short time of the hackathon not possible. Therefore Tableau visaulisations were created without a connection and with a sample dataset. \nThe original idea was, to have a connection to MongoDB server which is regularly updated in order to have nearly real time data of the input of the zip codes at the events.\n\nHere is an example of what it could look like on the tablet. Further visualisations can be found in the folder images in the power point presentation. \n\n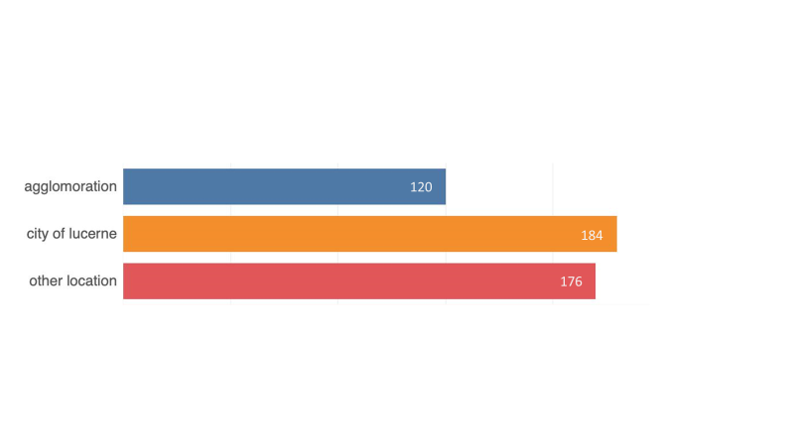\n\n## 3) Next steps\n1. Frontend enlargement. To make it more user friendly the setup should be brought to the cloud. This would make the data more accessible for different users. Additionally, more postal codes are added for surrounding areas and the design of the web app is finalised.\n2. Create further visualisations to give feedback to the visitors at the events. \n3. In order for the city of Lucerne to have an overview over the visitors, a second use case is created. According to the needs of the city of Lucerne visualisations in Tableau will be created. \n4. A pilot should be setup at one event location to test the web app.\n","autotext_url":"https://github.com/ccetinkaya/hackday_t6","category_id":"","category_name":"","contact_url":"https://opendatahackdays.slack.com/archives/C01EMT2B9BK","created_at":"2020-10-29T19:58","download_url":"","event_name":"Shape My City","event_url":"https://new-hack.opendata.ch/event/35","excerpt":"\r\n\r\n# Problem\r\n\r\nThe City of Lucerne would like to register how many people visiting cultural events in the City of Lucerne are actually residents of Lucerne and how many are visiting from the agglomeration (K5: Ebikon, Emmen, Horw, Kriens, City of Lucerne incl. Littau and Reussb\u00fchl) or even outside the Region. This information would be used by the City of Lucerne to discuss more ...","hashtag":"","id":653,"ident":null,"image_url":"https://bucketeer-036aa605-c047-4623-8610-f1764b90cf98.s3.amazonaws.com/public/YL9WEVS859739ZP0G8ZJAPNY.jpg","is_challenge":true,"is_webembed":true,"logo_color":"","logo_icon":"","longtext":"\r\n\r\n# Problem\r\n\r\nThe City of Lucerne would like to register how many people visiting cultural events in the City of Lucerne are actually residents of Lucerne and how many are visiting from the agglomeration (K5: Ebikon, Emmen, Horw, Kriens, City of Lucerne incl. Littau and Reussb\u00fchl) or even outside the Region. This information would be used by the City of Lucerne to discuss more accurately with the agglomeration, how much they have to pay to the city on cultural promotion.\r\n\r\n# Idea\r\n\r\nAt the entrance of the cultural events we would put a tablet where visitors are asked to insert the zip code of their home address. This would be a voluntary process and the visitors will be rewarded with a funny thank you note, once they put in the information.\r\nFor the City of Lucerne a dashboard with visualisations of the visitor flow to the different cultural events can be created.\r\n\r\n# Goal\r\n\r\nCreate a prototype of a technical solution to count visitors of cultural events. What is the percentage of visitors from the city of Lucerne and the surrounding municipalities? \r\n\r\n# Data\r\n\r\nThere is no data which can be used as the goal of the challenge is to find a way of collecting the data.\r\n\r\n# Partner\r\n\r\nJudith Christen\r\nCity of Lucerne, Kultur & Sport\r\n\r\n\r\n\r\n\r\n\r\n","maintainer":"wagunase","name":"06 Quantification of visitors of cultural events in Lucerne","phase":"Challenge","progress":0,"score":92,"source_url":"https://github.com/ccetinkaya/hackday_t6","stats":{"commits":0,"during":41,"people":7,"sizepitch":1492,"sizetotal":5703,"total":51,"updates":43},"summary":"Create a prototype of a technical solution to count visitors of cultural events.","team":"wagunase, wacetink, warickli, waisch, wnschaer, christina_sudermann, AR8","team_count":7,"updated_at":"2020-11-28T14:19","url":"https://new-hack.opendata.ch/project/653","webpage_url":"https://docs.google.com/presentation/d/e/2PACX-1vTaX11wB2v_OaGtGNXXQB33CW7Uz-FxiAMVFjoEx34Oy7SDub5fWL-24Q254flGq1jZawkXYniYEQij/embed"},{"autotext":"# Analysis-of-energy-inefficient-buildings\n## Project description \nRising Prices, shrinking resources, liability for climate and environment are just a few reasons to challenge our energy consumption and approach a more thoughtful and economical way. Buildings in Switzerland are responsible for about 45 % of energy usage. EMPA would like to change this by combining open data and modern technologies like neural network classification to evaluate buildings worth a structural energy efficiency upgrade and reduce energy loss in the city Lucerne. For the performance of image analysis and model training we first need a solid infrastructure to retrieve and store data. With our project we would like to tackle this challenge. \n\n## Technical Base\nThe application is using Python and PostgreSQL to save the data provided by the google API. The connection data like username, password, database name, etc. are stored in server.ini. \n## Architecture\nThere are several classes that manage the database connection, the creation of table entries and the saving of the pictures to the file system.\nThe semantic key to access a picture is given through its address. The zip-code, the street and the building number are used to access the data sets and check whether an entry exists or not. If a building does not exist yet in the database a uuid-key is generated and used as a primary key for the building. The picture is saved with the \u201cuuid\u201d.jpg as filename. \n## Classes\n\u2022\tDBConnection: Manages the DB connections and handles DB cursors\n\n\u2022\tDBCursor: little Proxy for Cursors\n\n\u2022\tBuilding: The Buillding class is meant to manage the access and the storing of pictures and meta data.\n\n\u2022\tImageExtractor: Interface to Google Street View API\n\n## Files\n\u2022\taddresses.txt: some sample addresses for testing and mockup\n\n\u2022\tBuilding_database.py: home of Class Building\n\n\u2022\tcreate_tables.py: Creates the needed DB tables\n\n\u2022\tdb_connection.py: home of Classes DBConnection and DBCursor\n\n\u2022\tgoogle_street_extractor.py: home of Class ImageExtractor\n\n\u2022\tkey.txt: not used in prototype. Is supposed to contain the Google Street View API key\n\n\u2022\tmain.py: Mockup of functionality. Reads addresses from addresses.txt and extracts data and images from google street view and saves them in the database using Classes ImageExtractor and Building\n\n\u2022\tReadme.md\u2026\n\n\u2022\trequirements.txt: contains all necessary requirements (Anaconda style)\n\n\u2022\tserver.ini: contains all configuration data (to be adjusted by customer by write_db_config.py)\n\n\u2022\ttest_retrieve.py: Test of extraction of data and images that were written with main.py\n\n\u2022\twrite_db_config.py: writes parameters to server.ini\n\n## Data\nThe data was retrieved with a Google API Key \n\n## Authors \nDominik Vasquez, Stephan Wernli, Luca Casuscelli, Jonas Z\u00fcrcher \n\n","autotext_url":"https://github.com/Duneyr4/Analysis-of-energy-inefficient-buildings","category_id":"","category_name":"","contact_url":"https://github.com/Duneyr4/Analysis-of-energy-inefficient-buildings/issues","created_at":"2020-10-30T09:01","download_url":"","event_name":"Shape My City","event_url":"https://new-hack.opendata.ch/event/35","excerpt":"## Problem\r\nRising Prices, shrinking resources, liability for climate and environment are just a few reasons to challenge our energy consumption and approach a more thoughtful and economical way. Buildings in Switzerland are responsible for about 45 % of energy usage. EMPA would like to change this by combining open data and modern technologies like neural network classification to evaluate buildings worth a structural energy efficiency upgrade and reduce energy loss in the city Lucerne. \r\n\r\n## ...","hashtag":"","id":656,"ident":null,"image_url":"","is_challenge":true,"is_webembed":true,"logo_color":"","logo_icon":"","longtext":"## Problem\r\nRising Prices, shrinking resources, liability for climate and environment are just a few reasons to challenge our energy consumption and approach a more thoughtful and economical way. Buildings in Switzerland are responsible for about 45 % of energy usage. EMPA would like to change this by combining open data and modern technologies like neural network classification to evaluate buildings worth a structural energy efficiency upgrade and reduce energy loss in the city Lucerne. \r\n\r\n## Solution \r\nOur solution is all about improving the process of analysing building structures. Image data based challenges need a solid infrastructure for further use. Therefore we implemented an easy to use python script to retrieve images by using the google API and to save them in a PostgreSQL database. Furthermore we developed a prototype mockup for a gamified user application to check image quality, to provide image information and to add images manually.\r\nMockup-Link: https://share.proto.io/U768ZR/ \r\n\r\n## Outlook\r\n- Build a working prototype for the user\r\n- Implement labeling features in the app and the database structure \r\n- Think about gamified solutions to calculate the windows to wall ration on a building (include a drawing functionality \r\n\r\n## Project repository \r\nhttps://github.com/Duneyr4/Analysis-of-energy-inefficient-buildings\r\n\r\n## Challengers\r\nDominik Vasquez, Stephan Wernli, Luca Casuscelli, Jonas Z\u00fcrcher\r\n","maintainer":"lucacelli","name":"12: Find energy inefficient buildings in the city of Lucerne","phase":"Challenge","progress":0,"score":84,"source_url":"https://github.com/Duneyr4/Analysis-of-energy-inefficient-buildings","stats":{"commits":0,"during":37,"people":1,"sizepitch":1434,"sizetotal":4262,"total":46,"updates":44},"summary":"Improve the process of analysing building structures.","team":"lucacelli","team_count":1,"updated_at":"2020-11-28T13:10","url":"https://new-hack.opendata.ch/project/656","webpage_url":"https://docs.google.com/presentation/d/e/2PACX-1vSESN-siT1g3AzMzW3J9kHBVcmrXmLhrmuOwVFW_g_7oMxDL3PaWeYR4bEeSOv5R_XvxEyfFpa86iel/embed?start=true&loop=false&delayms=3000\" frameborder=\"0\" width=\"960\" height=\"569\" allowfullscreen=\"true\""},{"autotext":"# open_social_spaces","autotext_url":"https://github.com/andygubser/open_social_spaces/","category_id":"","category_name":"","contact_url":"https://opendatahackdays.slack.com/archives/C01E1SG3HU1","created_at":"2020-10-16T10:30","download_url":"","event_name":"Shape My City","event_url":"https://new-hack.opendata.ch/event/35","excerpt":"## Idea:\r\n\r\nAt the Open Data Hackdays 2020, a creative solution is being sought for the exchange of information on the use of open social spaces between the residents and the municipality of Horw.\r\n\r\n## Prototype:\r\n\r\nThe R\u00fcteliwiese in the municipality of Horw is a meeting place for old and young and is used for a variety of purposes. Especially in summer, you will find many bathers and cyclists there. The municipality of Horw is now asking itself how this open social space can be improved for t...","hashtag":"","id":605,"ident":null,"image_url":"https://github.com/caro-mat/open-data-challenge/blob/main/rueteliwiese.png?raw=true","is_challenge":true,"is_webembed":true,"logo_color":"#94e3fe","logo_icon":"","longtext":"## Idea:\r\n\r\nAt the Open Data Hackdays 2020, a creative solution is being sought for the exchange of information on the use of open social spaces between the residents and the municipality of Horw.\r\n\r\n## Prototype:\r\n\r\nThe R\u00fcteliwiese in the municipality of Horw is a meeting place for old and young and is used for a variety of purposes. Especially in summer, you will find many bathers and cyclists there. The municipality of Horw is now asking itself how this open social space can be improved for the benefit of the community?\r\n\r\n## Goal: \r\n\r\nThe residents of Horw should be able to communicate their ideas and needs for the design of the R\u00fcteliwiese. It should also be possible to share and evaluate these ideas with others. In addition, your interactive solution should activate the residents to participate in your project \"Shape the R\u00fcteliwiese of Horw\". Be creative, think simple and use public data. The idea should be usable for other social spaces too. \r\n\r\n## Data sources:\r\n\r\n* Google Picture\r\n* Open Street Map: https://planet.osm.ch\r\n* Zone Map of Horw: https://www.geo.lu.ch/map/zonenplan\r\n* GeoPortal Canton of Lucerne: https://geoportal.lu.ch\r\n\r\n## Partner:\r\n\r\nBuilding Department of the Municipality of Horw, Spatial Planning\r\n\r\n-------------------------------------------------------------------------------------------------------------------------------------\r\n## Documentation:\r\n\r\n# Project: Open Social Spaces (\u201cR\u00fcteliwiese, Horw\u201d)\r\nProject members: Gino Cattelan (gino.cattelan@stud.hslu.ch), Gianni Pinelli(gianni.pinelli@stud.hslu.ch), Stefan H\u00fcttenmoser (stefan.huettenmoser@stud.hslu.ch), Benjamin Auer (auer.benjamin@gmail.com) , Andy Gubser (Conceptual Coaching)(andy.gubser@stud.hslu.ch), Marco Hassan und Raphael Tholl (Technical Coaching)\r\nPlease add your contact detail / github links\r\nLink to opendata.ch: https://hack.opendata.ch/project/605\r\n\r\n### Executive Summary\r\n#### Why ?\r\nRegarding spatial planning local governments often face different challenges. Town hall meetings are often attended by a very homogeneous group consisting of mostly elderly people, while the groups actually using the open social spaces, in particular the youth and minorities, are often underrepresented.\r\n\r\n\r\n#### How?\r\nWe quickly came to the conclusion that a solution is required to invite locals to get involved with shaping their open social spaces. We evaluated different ideas from using BIM objects to creating an App. With the available resources we decided on creating a very easily accessible, 2D design tool that also includes the possibility to share, read and vote on different ideas.\r\n\r\n\r\n#### What?\r\nWe developed a web application accessible via on site QR code. On the application you\u2019re then able to place certain items like trees, benches ect. on a map with AR. It\u2019s then possible for the individual to vote on the ideas of other participants. This data then can be exported into a JSON Database for the government to use.\r\n\r\n\r\n### Input \r\n#### What: \r\nWe created an online AR-Tool to generate Data.\r\nOn their phone, users can select from different objects (park bench, park bin, tree) and place them in AR into the park.\r\nGeodata from phone is added to placed objects\r\n\r\n##### How: \r\nJavaScript, HTML and CSS were used to build the Web-Application\r\nWebXR (ARCore based) was implemented to access AR\r\nExample code was used and customized for our problem (https://github.com/googlecodelabs/ar-with-webxr/archive/master.zip)\r\n3D low-poly models (park bench, park bin, tree) were made using Blender\r\n\r\n#### Obstacles: \r\nNo previous knowledge on web AR applications\r\nWeb AR application only runs on very recent phones (https://developers.google.com/ar/discover/supported-devices)\r\nAdding geodata to AR objects needs some additional calculations and code (not done yet)\r\nThe used ARCore library only works with HTTPS, not on the local network. Therefore we had to use a temporary website (https://star.cyon.site)\r\n\r\n\r\n\r\n### Outlook\r\n#### Next steps: \r\nWhat would you need (data, skills, tools \u2026)? \r\nWill you keep on working on the project? \r\n\r\n\r\n\r\n\r\n#### Input IBMler\r\nPython erzeugt Daten, welche sp\u00e4ter via Node-RED auf einer Weltkarte angezeigt werden\r\nPython schickt Daten an Node-RED via API (http POST request)\r\nNode-RED bietet Usern die M\u00f6glichkeit verschiedene Objekte auf der Weltkarte anzuzeigen e.g. B\u00e4ume, B\u00e4nke usw.\r\nUser w\u00e4hlen anzuzeigende Objekte via Dropdown Menu Node (Dashboard Nodes) aus. Ein Switch Case und Array.filter filtern dann die von Python kommenden Daten basierend auf der User Auswahl.\r\n\r\nHier zwei Links die helfen in JavaScript ein Switch Case und Array.filter zu nutzen:\r\n\r\nSwitch Case: https://developer.mozilla.org/de/docs/Web/JavaScript/Reference/Statements/switch\r\n\r\nArray.filter: https://javascript.info/array-methods#filter\r\n\r\n\r\n","maintainer":"Sany","name":"08. Open Social Spaces ","phase":"Challenge","progress":0,"score":67,"source_url":"https://drive.google.com/drive/folders/1EjHhKTdJBoTQOR4ixE-xqiE1H8m8XJ8T","stats":{"commits":0,"during":6,"people":6,"sizepitch":4920,"sizetotal":5021,"total":37,"updates":30},"summary":"Organisation of Open Social Spaces using the example of the\u00a0\"R\u00fcteliwiese\" in Horw","team":"Sany, andy_gubser, Konstantinos, Gino, Carole, Gianni","team_count":6,"updated_at":"2020-11-28T15:31","url":"https://new-hack.opendata.ch/project/605","webpage_url":"https://star.cyon.site/"},{"autotext":"","autotext_url":"","category_id":"","category_name":"","contact_url":"https://opendatahackdays.slack.com/archives/C01BVQEJHMM","created_at":"2020-10-29T13:54","download_url":"","event_name":"Shape My City","event_url":"https://new-hack.opendata.ch/event/35","excerpt":"\r\n# Idea\r\nThe aim of the project is to sensitize the population in the canton of Lucerne to the topic of the environment.\r\n\r\n# Challenge\r\nVarious persona are to be compiled on the basis of data that provide information on budget income/expenditure, demographic characteristics, opinions on the environment in the Canton of Lucerne, as well as data that describe the population's perception of the environment at federal level. The personas produced will describe the individual consumer groups.\r\n\r\nOn...","hashtag":"","id":615,"ident":null,"image_url":"https://cdn.pixabay.com/photo/2016/01/27/22/10/shopping-1165437_960_720.jpg","is_challenge":true,"is_webembed":false,"logo_color":"#acde4e","logo_icon":"","longtext":"\r\n# Idea\r\nThe aim of the project is to sensitize the population in the canton of Lucerne to the topic of the environment.\r\n\r\n# Challenge\r\nVarious persona are to be compiled on the basis of data that provide information on budget income/expenditure, demographic characteristics, opinions on the environment in the Canton of Lucerne, as well as data that describe the population's perception of the environment at federal level. The personas produced will describe the individual consumer groups.\r\n\r\nOn the one hand, the data at cantonal level from the LUStat and Bfs will help us to make direct statements about the Canton of Lucerne, and on the other hand, the data from Bfs at federal level can be linked by age group, household size and other factors and thus help us to draw conclusions. These findings can be used to raise awareness of environmental issues among the relevant groups. In addition, further measures for environmental counselling can be derived, such as marketing campaigns to actively address the relevant consumer group. \r\n\r\n# Goal\r\nThe personas produced will describe the individual consumer groups.\r\n\r\n# First Update (27.11.2020) \r\nGet together with the team member --> Storming, Norming, Forming, Performing. In the first point it was more about knowing the challenge and collect the requirements with the challenge owner. After we knew what to do and estimate the scope of the challenge we decided to split to 2 groups: One group was focusing on the consum behavior and the other group was focusing on the persona indicator as well as which indicators can influence the habitat concerning the living (heating cost, rental cost etc..). The main goal was to prepare the data in order to combine several files which were found on BFS and LuStat. The biggest effort was to collect the specific data and to merge it and in order to do that we needed to understand the data and do some mathematical calculations.\r\n\r\n# Second Update (28.11.2020) \r\nAt that point we had the data ready to do the specified personas. The two groups came together to discuss the findings and based on these findings we created two persona: environmental neutral and environmental sceptic. Furthermore, we prepared the slides for the presentation which leads us to do a retrospective on the project --> We discussed what our obstacles and what the key points of our finding were. \r\n\r\n# The created Personas \r\n\r\n\r\n\r\n\r\n\r\n# Data Sources\r\n**Bundesamt f\u00fcr Statistik**\r\n\r\nDetailed data available by canton, by household type and by age group\r\n
Perception of the environment by the population\r\n\r\n**Lustat Statistik Kanton Luzern**\r\n\r\nData on the income of persons in Lucerne\r\n
Data on the age structure of people in Lucerne\r\n
Data on municipal waste in Lucerne\r\n\r\n\r\n\r\n\r\n\r\n\r\n\r\n\r\n\r\n\r\n\r\n\r\n\r\n\r\n\r\n\r\n","maintainer":"AR8","name":"04: Consumer behavior of the population in the canton of Lucerne","phase":"Challenge","progress":0,"score":61,"source_url":"https://github.com/G-Unit-777/consumer_behavior_lucerne","stats":{"commits":0,"during":13,"people":8,"sizepitch":2989,"sizetotal":3109,"total":35,"updates":26},"summary":"Different persona are to be compiled on the basis of data from Bfs and LuStat to raise awareness of environmental issues","team":"AR8, ncad, NBos, Ciro, martina, eric, COez","team_count":8,"updated_at":"2020-12-03T16:55","url":"https://new-hack.opendata.ch/project/615","webpage_url":""},{"autotext":"","autotext_url":"","category_id":"","category_name":"","contact_url":"https://opendatahackdays.slack.com/archives/C01FGHRDNU9","created_at":"2020-10-30T14:08","download_url":"","event_name":"Shape My City","event_url":"https://new-hack.opendata.ch/event/35","excerpt":"## IDEA\r\n\r\nThe aim of the challenge is to visualize the energy use of buildings either in 3D or 2D based on energy simulation data. The visualization should be interactive and the users should be able to discover information about the buildings from the graphics. The information which is visualized is not limited to energy use but also any additional knowledge the challengers can engineer from the results (e.g. identification of cluster of high demand, reporting at different spatial levels i.e. ...","hashtag":"","id":657,"ident":null,"image_url":"","is_challenge":true,"is_webembed":true,"logo_color":"","logo_icon":"","longtext":"## IDEA\r\n\r\nThe aim of the challenge is to visualize the energy use of buildings either in 3D or 2D based on energy simulation data. The visualization should be interactive and the users should be able to discover information about the buildings from the graphics. The information which is visualized is not limited to energy use but also any additional knowledge the challengers can engineer from the results (e.g. identification of cluster of high demand, reporting at different spatial levels i.e. postcode, identification of areas that could benefit most from energy saving strategies, etc.).\r\n\r\n## TASKS\r\n\r\n-\tunderstanding data\r\n-\tdetermine and develop the key figures to be visualized\r\n-\tchoosing the tool for the visualization\r\n-\timplementing the visualization\r\n-\tknowledge engineering \r\n\r\n## DATA FILES\r\n\r\n-\tenergy simulation data\r\n-\tdescription of the attributes from the simulation\r\n\r\nData files will be provided by the challenge owner (protected data)\r\n\r\n\r\n## THE SOLUTION\r\n\r\nThe creation of this 3D interactive application (GUI) requires various preceding steps. The data challenge team therefore decided to build a pipeline.\r\n\r\nThe pipeline basically consists of 4 parts: \r\n\r\n1.\tSetting up the basic infrastructure \r\n2.\tData collection\r\n3.\tData preparation (apply relevant Skripts)\r\n4.\tLayer creation\r\n5.\tUse of GUIs\r\n\r\n\r\n\r\n\r\n## FINDINGS\r\n\r\n- Nested Data structure (CityGML Data, xml, kml, json, gltf, ...)\r\n- many possible approaches exist (Python, Web application, R, \u2026) \r\n\r\n\r\n## OBSTACLES\r\n\r\n- handling & understanding of data structure\r\n- Adapt Visual to research question (Adapt javascript of 3D-CityDB Web Client)\r\n\r\n## NEXT STEPS\r\n\r\n- Colouring of Layers in Web-Client\r\n- Automation of current manuelly tasks\r\n- Further evaluation of 3D-Visualization-Tools with more flexible GUI\r\n\r\n### Link to the presentation\r\nhttps://docs.google.com/presentation/d/e/2PACX-1vSW417-QUEQ1yp6sUpuPKj4A3mDGkAVsIlcnJCQej1JGgL7o-5xZQOmAXxlIVmCzw/pub?start=false&loop=false&delayms=3000\r\n\r\n### Link to the documentation\r\nhttps://drive.google.com/file/d/1yh-YxZTv9sdGHPrFod-qItmmLhysTtSX/view?usp=sharing\r\n","maintainer":"odermattmi","name":"103 - Geovisualization of simulated building energy demands","phase":"Challenge","progress":0,"score":56,"source_url":"","stats":{"commits":0,"during":35,"people":2,"sizepitch":2220,"sizetotal":2308,"total":39,"updates":36},"summary":"Interactive visualization of the energy use of buildings based on energy simulation data","team":"odermattmi, JF","team_count":2,"updated_at":"2020-11-28T15:17","url":"https://new-hack.opendata.ch/project/657","webpage_url":""},{"autotext":"","autotext_url":"","category_id":"","category_name":"","contact_url":"https://opendatahackdays.slack.com/archives/C01E9EPJW9Z","created_at":"2020-10-29T15:46","download_url":"","event_name":"Shape My City","event_url":"https://new-hack.opendata.ch/event/35","excerpt":"**Original Challenge**\r\nThe goal is to visualize the existing data of the small sub-quarters in a way that they can be integrated or linked into/with the existing website. An example for this would be the representation on a dynamic map of the small quarters. The displayed data must always be up-to-date, shows changes and development and should therefore generate added value and information for the visitors of the website and for planning by neighbourhood organisations and the city.\r\n\r\n**Update ...","hashtag":"","id":617,"ident":null,"image_url":"","is_challenge":true,"is_webembed":false,"logo_color":"#dbdbdb","logo_icon":"","longtext":"**Original Challenge**\r\nThe goal is to visualize the existing data of the small sub-quarters in a way that they can be integrated or linked into/with the existing website. An example for this would be the representation on a dynamic map of the small quarters. The displayed data must always be up-to-date, shows changes and development and should therefore generate added value and information for the visitors of the website and for planning by neighbourhood organisations and the city.\r\n\r\n**Update 28.11.2020**\r\nDuring the hackdays, the hackers of this challenge visualized existing data of the small sub-quarters to gain valuable insights about the facts, needs and participation of the residents in those neighbourhoods. The hackers did so by using the business analytics tool Power BI to provide interactive visualizations and one can make its own analysis without any previous knowledge what is especially important when reaching all residents from a neighbourhood where not everyone has a technological affinity. \r\n\r\n**What did we find out**\r\nWhat topics are especially important to the residents and how and where they would like to participate in discussions.\r\nMoreover, deeper insights about the values of the neighbourhood association W\u00fcrzenbach and voting Participation, including demography details on the neighbourhood W\u00fcrzenbach.\r\n\r\n**Next steps**\r\nThe insights and visualisation need to be integrated into the website to make the findings accessible to all residents. \r\nMoreover, a dynamic map of the small quarters should be created what is a need from the original challenge owner. \r\n\r\n**Our interactive dashboards**\r\n\r\n\r\n\r\n\r\n\r\n\r\n\r\n\r\n\r\n\r\n\r\nAvailable Datasets\r\n\u2022\tStatistical borders of small sub-quarters (https://webgis.stadtluzern.ch/WebOffice/synserver?project=admin_einteilung&user=guest&client=core)\r\n\u2022\tGrade of Activation at Neighbourhood Association\r\n\u2022\tPopulation Data 2014 \u2013 2019 (Demographic)\r\n\u2022\tEmployer Data 2016\r\n\u2022\tParticipation in Voting\r\n\u2022\tValue Survey\r\n\r\n*Project link*\r\nhttps://github.com/LinoSimoni/shapemycity\r\n\r\n*Participants*\r\nLuca Cincera / Carmen Moreno / Lino Simoni / Marc Sprenger\r\n\r\n*Contact details*\r\nLuca Cincera, luca.cincera@stud.hslu.ch\r\nCarmen Moreno, carmen.boehler@stud.hslu.ch\r\nLino Simoni, lino.simoni@stud.hslu.ch\r\nMarc Sprenger, marc.sprenger@stud.hslu.ch\r\n\r\n**Pitch pr\u00e4sentation**\r\nhttps://docs.google.com/presentation/d/e/2PACX-1vTEFsVtGKn4M3sMCHMefoHhiHulghhS469wC0Tv2Z_e77CZvWB6hfz64yEl6T6ESZsGCaAFngL2_7g-/pub?start=false&loop=false&delayms=3000","maintainer":"ALiebrich","name":"102: Small Neighbourhoods","phase":"Challenge","progress":0,"score":55,"source_url":"","stats":{"commits":0,"during":25,"people":4,"sizepitch":3090,"sizetotal":3208,"total":32,"updates":27},"summary":"Visualize existing data of the small sub-quarters to gain valuable insights about the participation of those residents","team":"ALiebrich, andy_gubser, carmen_moreno, AR8","team_count":4,"updated_at":"2020-11-28T14:06","url":"https://new-hack.opendata.ch/project/617","webpage_url":"https://docs.google.com/presentation/d/e/2PACX-1vTEFsVtGKn4M3sMCHMefoHhiHulghhS469wC0Tv2Z_e77CZvWB6hfz64yEl6T6ESZsGCaAFngL2_7g-/pub?start=false&loop=false&delayms=3000/embed"},{"autotext":"","autotext_url":"","category_id":"","category_name":"","contact_url":"https://opendatahackdays.slack.com/archives/C01E6619BJR","created_at":"2020-10-27T06:35","download_url":"","event_name":"Shape My City","event_url":"https://new-hack.opendata.ch/event/35","excerpt":"Initial situation:\r\n\r\nThe CO2-neutral neighbourhoods make a significant contribution to driving forward the energy turnaround. With the help of a change in energy supply and increased energy efficiency in buildings, primary energy consumption and greenhouse gas emissions can significantly be reduced. Buildings account for 24% of greenhouse gas emissions in Switzerland (Federal Statistical Office). Climate-neutral neighbourhoods pursue the approach of reducing the energy requirements of buildings...","hashtag":"","id":613,"ident":null,"image_url":"","is_challenge":true,"is_webembed":true,"logo_color":"","logo_icon":"","longtext":"Initial situation:\r\n\r\nThe CO2-neutral neighbourhoods make a significant contribution to driving forward the energy turnaround. With the help of a change in energy supply and increased energy efficiency in buildings, primary energy consumption and greenhouse gas emissions can significantly be reduced. Buildings account for 24% of greenhouse gas emissions in Switzerland (Federal Statistical Office). Climate-neutral neighbourhoods pursue the approach of reducing the energy requirements of buildings as far as possible, optimising the systems engineering and covering the remaining energy requirements with renewable energies.\r\n\r\nIdea:\r\n\r\nTo determine the current level of CO-2 emissions in the districts of the City of Lucerne, the data provided will be used to visualise which heating methods the buildings are using. The comparison of the CO2 emissions of the heating methods will also be integrated into the visualisation. This visualisation will then make it possible to see which buildings can heat with a more efficient heating method and thus significantly reduce greenhouse gas emissions. The long-term goal of the energy concept is to develop an energy-efficient neighbourhood that is managed independently of fossil fuels.\r\n\r\nTarget:\r\n\r\nThe aim of this challenge is to create a visualisation of CO2 emissions as a contribution to the energy turnaround in the districts of the city of Lucerne. It is important that the data is aggregated on the level oft the different city districts. In addition to the data provided, further data that can be accessed online can be integrated. \r\n\r\nHackdays:\r\n \r\nUsing the available data, the hackers visualised important information during the Hackdays regarding the heating methods used in the districts of the city of Lucerne. The four hackers used Python for data processing and visualisation. An interactive visualisation is available to the user. In future, this can also be supplemented with consumption information on the buildings.\r\nDue to data protection guidelines, the data and the visualisation may only be used and edited by authorised persons.\r\n\r\nWhat have we found out?\r\n\r\nThe visualisation shows which quarters are heated in which way.\r\n\r\n\r\n\r\n\r\n\r\n\r\n\r\n\r\n\r\n\r\n\r\n\r\n\r\n\r\n\r\n\r\n\r\n\r\n\r\n\r\n\r\n\r\n\r\nNext steps:\r\n\r\nBy implementing the consumption information for the buildings, a visualisation can be created which shows which buildings emit how much CO2.\r\n\r\nParticipants:\r\n\r\nYarkin G\u00f6tzmen, Alexandra Strohmeier, Rafael Morgenthaler, Sutki Hereqi\r\n\r\nContact:\r\n\r\nyarkin.goecmen@stud.hslu.ch\r\nalexandra.strohmeier@stud.hslu.ch\r\nrafael.morgenthaler@stud.hslu.ch\r\nsutki.hereqi@stud.hslu.ch\r\n\r\n\r\nData source:\r\n\r\nHausbezogene W\u00e4rmeerzeugung BFS \u2013 GWR 2015,\r\nZuordnungen der Hausbezogenen Daten zu den Quartiervereinen der Stadt Luzern\r\n\r\nPartners:\r\n\r\n- Martin Scherrer, President Association of Neighbourhood Associations\r\n- Alex Willener, Lecturer HSLU\r\n\r\n","maintainer":"AlexandraYanina","name":"105: Netto- Null in den Quartieren? ","phase":"Challenge","progress":0,"score":37,"source_url":"","stats":{"commits":0,"during":12,"people":5,"sizepitch":4063,"sizetotal":4158,"total":17,"updates":11},"summary":"Visualisierung des Ist-Zustands als beitrag zur Energiewende in den Quartieren der Satdt Luzern ","team":"AlexandraYanina, andy_gubser, Sutki, rafael, AR8","team_count":5,"updated_at":"2020-11-28T15:15","url":"https://new-hack.opendata.ch/project/613","webpage_url":"https://docs.google.com/presentation/d/e/2PACX-1vR2IADtstpaFOHnmQTL8icISUHygXyjsl6StcL5uCiq6DDuzHln1mewutr2LzN1dn0CdjOCHpqIVNCb/embed?start=false&loop=false&delayms=3000"},{"autotext":"","autotext_url":"https://public.tableau.com/profile/francisco.borge8567#!/vizhome/prototype_luzern_60_plus/Lucerne_60_plus_prototype","category_id":"","category_name":"","contact_url":"https://opendatahackdays.slack.com/archives/C01EZ3ZHYKA","created_at":"2020-10-29T17:58","download_url":"","event_name":"Shape My City","event_url":"https://new-hack.opendata.ch/event/35","excerpt":"# Problem\r\n\r\nAs we grow older, our needs and requirements for living change. Finding a suitable house or apartment can be a real challenge for all of us - but especially for the older population. Seniors face numerous housing challenges, including for example affordability, physical accessibility, and access to medical and other services inside and outside the home. Conventional housing platforms rarely take into account the specific needs of the older population in their search criteria. With t...","hashtag":"","id":618,"ident":null,"image_url":"","is_challenge":true,"is_webembed":true,"logo_color":"#61fa9c","logo_icon":"","longtext":"# Problem\r\n\r\nAs we grow older, our needs and requirements for living change. Finding a suitable house or apartment can be a real challenge for all of us - but especially for the older population. Seniors face numerous housing challenges, including for example affordability, physical accessibility, and access to medical and other services inside and outside the home. Conventional housing platforms rarely take into account the specific needs of the older population in their search criteria. With this challenge, we want to change this. \r\n\r\n# Goal\r\n\r\nWe want to enable senior citizens to search for an apartment or house online. The goal is to implement predefined search criteria in any programming language in order to develop a prototype platform that finds suitable apartment or houses for senior citizens. Criteria may include accessibility to services & infrastructure, lift, barrier free accessibility, public transport access, services, outdoor space, neighbourhood, etc.\r\n\r\n# Data sources\r\n\r\n- List of relevant search criteria (ranked according to target group's needs)\r\n- Housing advertisements from the city of Lucerne, collected via [Immoscout24 API](https://api.immobilienscout24.de/)\r\n- Open Street Maps\r\n\r\nHere the slides to the final presentation:\r\nhttps://docs.google.com/presentation/d/e/2PACX-1vQYHERpmwUBu3bPQUQB-Z-bLQt6c0kLKMZeJRRDRzoP6Mlw_ZjrklHSqTpY2Yc6lrBwRdffXoO0leZn/pub?start=false&loop=false&delayms=3000\r\n\r\nYou will find the link to our Tableau-visualization prototype here:\r\nhttps://public.tableau.com/profile/francisco.borge8567#!/vizhome/prototype_luzern_60_plus/Lucerne_60_plus_prototype\r\n\r\n\r\nYou will find further illustrations of the workflow and very simple user interface in the images below. \r\n\r\nDetailed description:\r\nThe idea is to have a very simple user interface where seniors can select the most important search criteria for a new flat. They can choose between must-have criteria and should-have criteria.\r\nThe search mask then queries the database which stores the json-data we already downloaded daily (according to a schedule) from the immo websites. These data are already enriched and tagged by NLP processes with a custom built NLP model. This is a huge added value as the json-files representing a flat advertisement often contain a \"False\" for information that has not been entered by the flat owner, but the text description actually does contain such information.\r\nAn example would be \"pets allowed\" or \"wheelchair accessible\", which often have \"False\" in the json file, hence one would assume that the flat does not fulfill that criterion. But when one does an analysis of the text description, one can often see that the text box indeed does contain verbal information like \"pets allowed upon request\" or \"barrierefrei\". It seems that instead of ticking all relevant boxes when publishing a flat advertisement, people rather use the text description to provide most necessary information. Further, some information like \"sonnig\" / \"sunny\" are typically based on personal interpretation and thus only represented written in the text description. Our NLP model takes this into consideration by doing text analysis and keyword tagging, by which the data is enriched and stored in our MongoDB store. From there, whenever there are search criteria activated in the user interface, the enriched and tagged data are being queried and ranked according to the best fit of the criteria. Then we have two types of result representation: a very simple one like a list with pictures, description, price and contact info as well as an interactive map -even with changeable search criteria again. The link to the interactive map prototype is in the project link below.\r\nHere is a more detailed description of the backend-processes:\r\nAll data is fetched with an HTTP Client via the Immoscout24 API periodically. We first had to fetch all the elements on\r\nthe overview page and for each flat the program loads the detailed information. The JSON file is then stored in a\r\nmongoDB.\r\nFor the web UI we provide a RestAPI which can handle different search criterias. For the purpose of this prototype we\r\nonly use the criteria accessability. This criteria is than passed to the FlatFinder module which queries the mongoDB and\r\nreturns the data in JSON format. The NLP Pipeline was build as well but not integrated in this prototype.\r\n\r\nHere is our very simple and basic user interface with the search mask:\r\n\r\n\r\n\r\n\r\n\r\nHere is the whole workflow in a very simple and basic manner, just to understand conceptually:\r\n\r\n\r\n\r\n\r\nAnd here is the detailed backend workflow process:\r\n\r\n\r\n","maintainer":"luca_h","name":"104: Flat finder for seniors","phase":"Challenge","progress":0,"score":0,"source_url":"https://github.com/kimmintu/data-challenge","stats":{"commits":0,"during":7,"people":4,"sizepitch":4967,"sizetotal":5022,"total":14,"updates":9},"summary":"Enabling seniors to find a place that fits their needs.","team":"luca_h, roger_wicki, Francisco_Borge, cornelia_gruber","team_count":4,"updated_at":"2021-09-28T13:43","url":"https://new-hack.opendata.ch/project/618","webpage_url":"https://public.tableau.com/app/profile/francisco.borge8567/viz/prototype_luzern_60_plus/Lucerne_60_plus_prototype"}],"name":"projects"}],"sources":[{"path":"https://new-hack.opendata.ch/","title":"dribdat"}],"title":"Shape My City","version":"0.9.3"}
|
 The contents of this website, unless otherwise stated, are licensed under a Creative Commons Attribution 4.0 International License.